API Security & Performance monitoring
Once you’ve installed the AIKO SDK and your app is sending events to our backend, you can chat with an AI agent in the AIKO Dashboard. Think of this agent as your personal cybersecurity professional who knows everything about your application. AIKO analyzes all your app’s data in real-time and can answer questions, investigate issues, and create visualizations to help you understand what’s happening in your application.How It Works
- Your app sends events to AIKO using the SDK
- All incoming data is analyzed in real-time
- Security alerts are surfaced automatically
- You can ask AIKO to provide explanations, create visualizations, and build dashboards
What AIKO Can Do For You
AIKO analyzes your application data and provides insights across several key areas: Security & Threat Detection - AIKO monitors for suspicious activity, unusual access patterns, and failed authentication attempts. It automatically surfaces security alerts and helps you understand what they mean for your application. Error Analysis - Track errors as they occur, understand why they’re happening, and identify patterns over time. AIKO can correlate error spikes with other events to help you pinpoint root causes. Traffic & Performance Monitoring - Get visibility into traffic patterns, user behavior, and performance bottlenecks. AIKO can show you which endpoints are most active and how performance correlates with traffic volume. Ask AIKO anything about your application’s behavior. Compare metrics across time periods, investigate specific time windows, or track down malicious or suspicious users. Just ask in your own words—AIKO will work with you to find the answer.AIKO Capabilities
Live Dashboards
AIKO can create persistent, shareable dashboards with the graphs you care about. These dashboards stay available for you and your team and update in real-time so you can monitor important metrics continuously. Simply ask AIKO to create a live dashboard with specific graphs, and it will build a live view that tracks changes as they happen.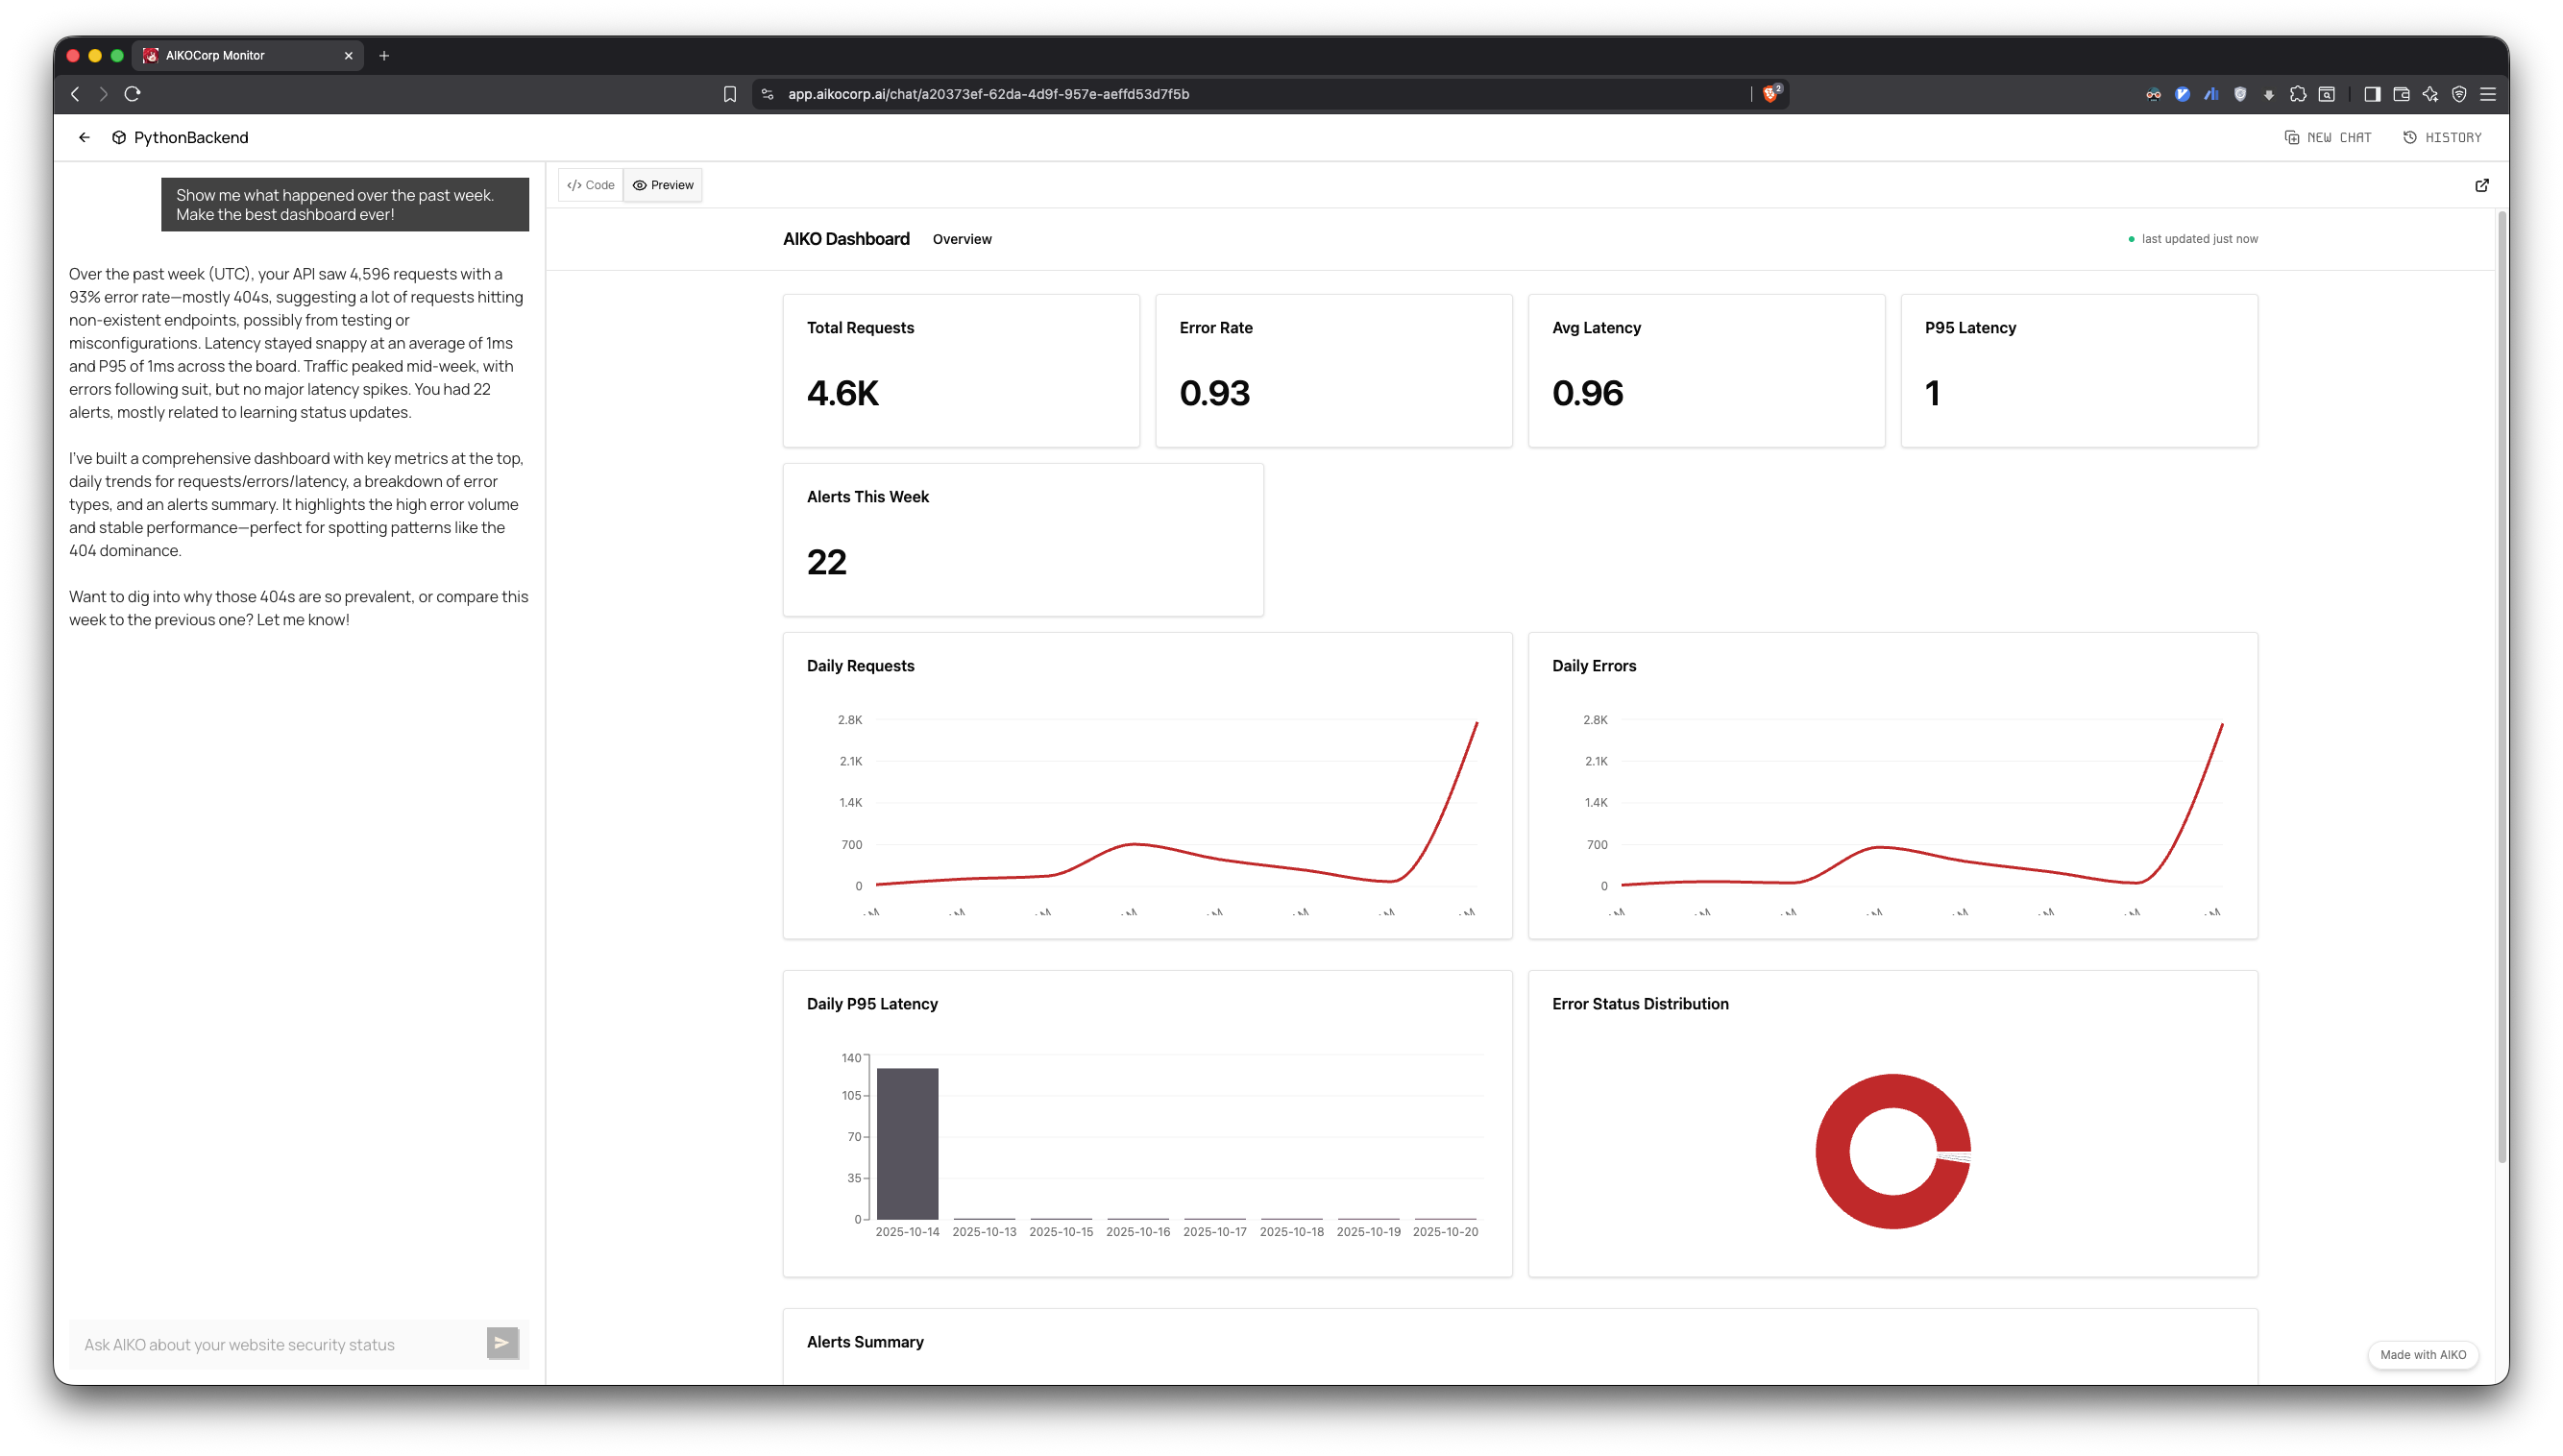
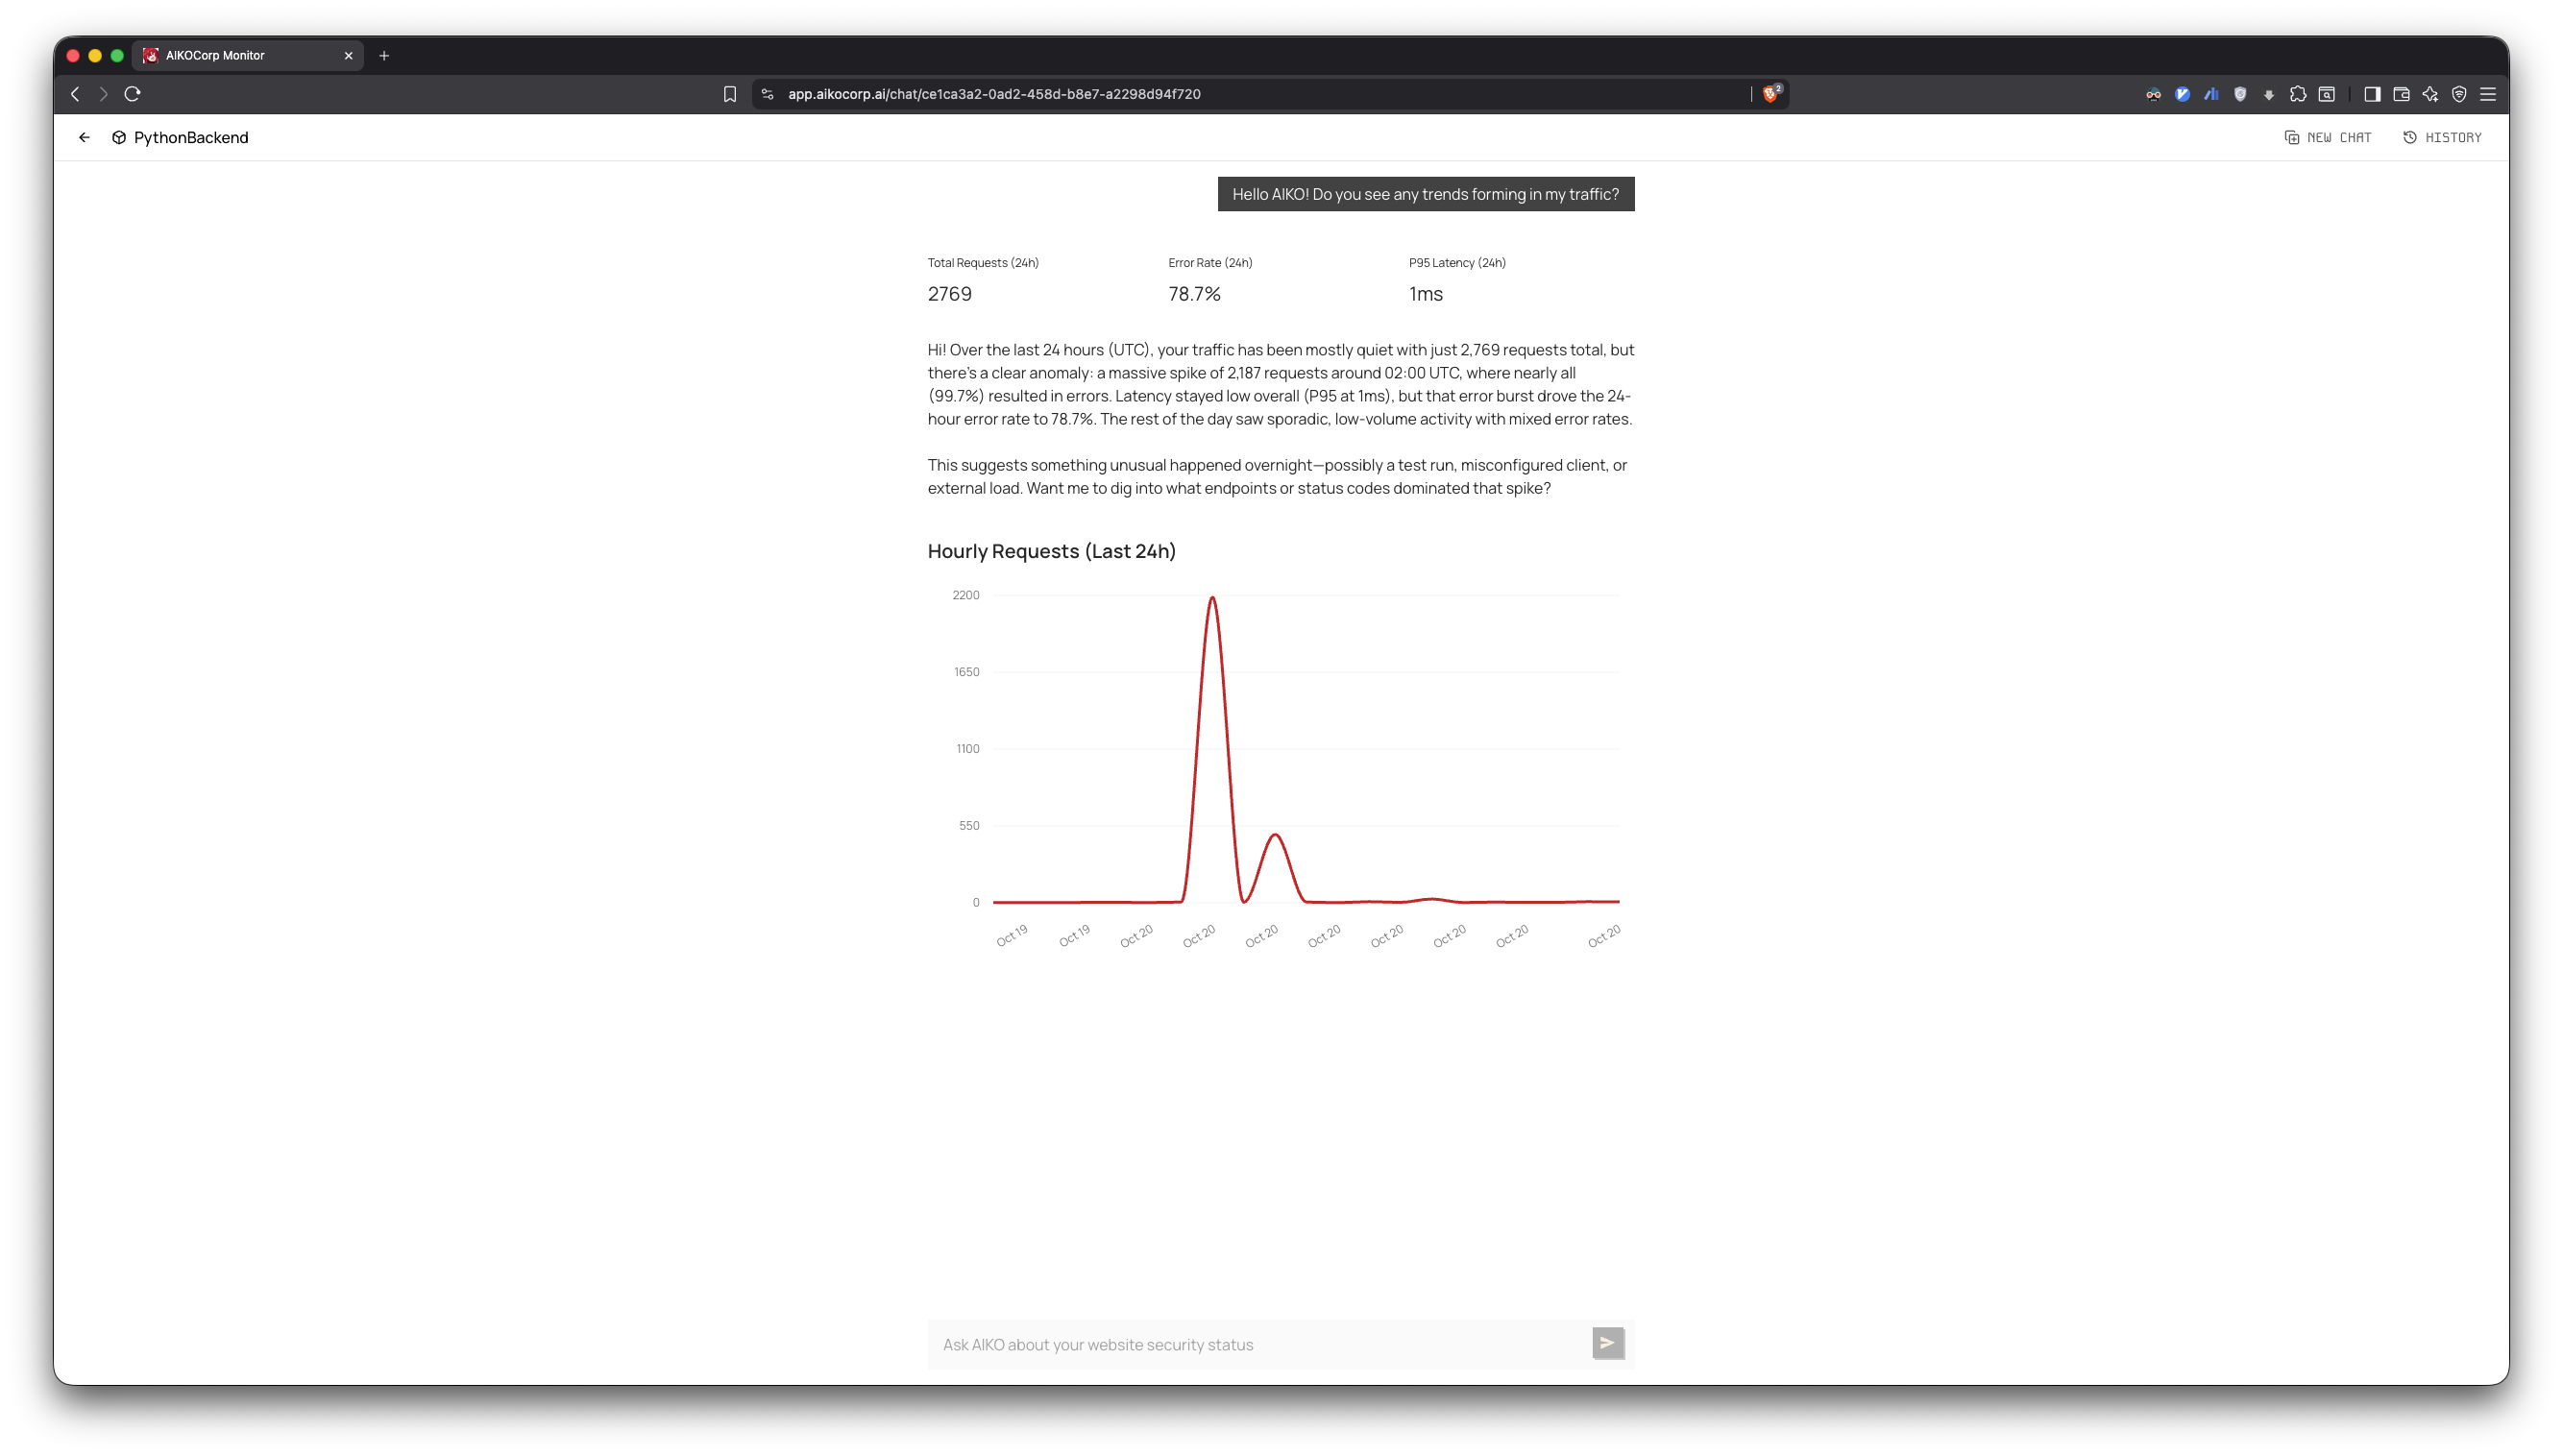
Custom Graph Generation
Need to visualize something specific? Just ask. AIKO can create graphs for:- Error rates over time
- Traffic patterns and trends
- Correlations between different metrics
- User-specific activity
- Any custom metric you want to track
Deep Investigation
AIKO investigates your data to explain what happened and why—going beyond surface-level alerts. Rather than just presenting answers, AIKO walks you through the analysis step-by-step. It asks clarifying questions, presents potential next steps, and waits for your input—guiding you interactively until you understand the root cause together.Get Started
Quickstart Guide
Install the SDK and start chatting with your AI agent